A few weeks ago, I posted a blog looking at optimising non-productive expenses from a measurement resource management perspective. Today I would like to take a closer look at the subject of measurement data and data formats. After all, it’s not only newly-obtained data (measurement system data and environmental data) that help to positively influence the balancing act between quality and the costs that arise to ensure this quality. Of course, the pure measured values, in addition to the identification of the quality of a component, also have an appreciable influence on the optimisation potential of the quality costs.
In this area, HxGN SMART Quality builds on the standard DFQ file format developed by Q-DAS with the Advanced Quality Data Exchange Format (AQDEF) – a worldwide, industry-proven standard for handling measurement system ratings. Because of the extensive experience that Q-DAS has in this field, many different measuring systems are already able to natively offer this file format. Suitable converters are simple to develop, so there is almost no measuring system that cannot generate DFQ files and thus be usable for HxGN SMART Quality. This fact underlines the claim of HxGN SMART Quality to be an open platform to a considerable extent.
But how can the data gained help to reduce or optimise the necessary effort? In addition to the classic applications of measurement data, such as the management of quality control charts or the determination of quality indexes (e.g. Cp and Cpk), the data can and will be used to support customers in a simpler way. Already today, these methods are used to reduce the number of samples and features to be measured under certain circumstances, namely when the statistically determined index has the required values and the characteristic can be regarded as ‘stable’. Most of this data is stored locally and used for optimisation locally and manually.
With HxGN SMART Quality, all the data obtained, regardless of the product, machine or standard, is provided centrally and thus offers the opportunity to centrally evaluate and process them. To do this, HxGN SMART Quality analyses all incoming and historical data and determines differentiated recommendations for each individual product, either to reduce the number of samples (or, of course, to increase them again if the impact is negative) and if necessary to ‘comment out’ individual measurements from the measurement program. This information is presented in a simple and targeted way to the user. In addition, it offers the ability to directly start a suitable workflow with discovered potential and thus to exploit the potentials. Both measures have considerable potential for savings, especially in terms of time, but ultimately also the costs.
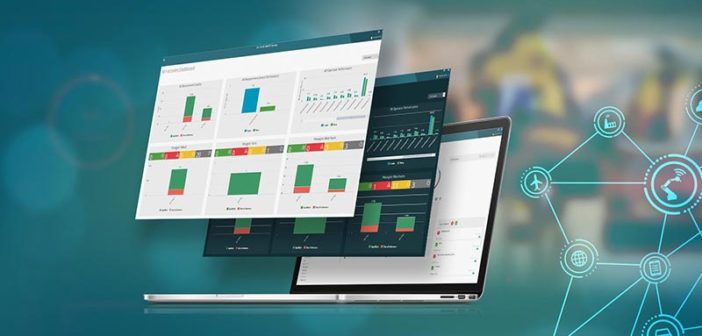
Another way that HxGN SMART Quality can use the data obtained is to directly display the measurement data in a simple green / red representation in a dashboard. Deviations from setpoints are immediately identified and displayed as red. Through drilldown, further detailed information can be called up and, if necessary, additional measures can be taken immediately and centrally for a local effect.
In my upcoming blog, I will pick up and expand on the topic of connectivity, and especially on our position as an open platform.


